

The U.S. helicopter industry logged its lowest number of fatal accidents in 25 years in 2024, with a fatal accident rate of 0.44 per 100,000 flight hours and an overall accident rate of 2.99 per 100,000 flight hours. Over the prior decade, the U.S. averaged 118 civil helicopter accidents and 37 deaths per year. These figures come primarily from the NTSB accident database, FAA/ASIAS flight-hour data, and Cirium’s fleet-wide safety reviews, all of which lag real time by months. The deeper breakdown, including mission-specific risk, follows below.
TL;DR:
- The 2024 fatal accident rate for U.S. civil helicopters is 0.44 per 100,000 flight hours, the lowest in 25 years, mainly due to targeted safety improvements.
- External load work and air medical transportation account for a disproportionate share of fatal accidents relative to their flight volume compared to other mission types.
- Pilot and operational error remains the primary cause of crashes, with weather and decision-making playing significant roles in low-altitude accidents.
- Helicopter safety has improved through multiple measures such as flight data monitoring, simulation training, and safety management systems, but risks vary by mission and aircraft type.
- Passengers should prioritize operator safety programs, aircraft engine configurations, and pilot experience over aircraft appearance when choosing a tour.
Table of Contents
- What The Helicopter Crash Statistics Actually Show
- Annual Accident Counts And Normalized Crash Rates
- What Causes Most Helicopter Crashes
- The Long-Term Safety Trend, And What’s Driving It
- How To Read Helicopter Crash Data Without Getting Misled
- What Passengers And Operators Should Take From The Numbers
- What Happens To Occupants During A Helicopter Crash
- Why Pilot Experience Shows Up So Clearly In The Data
- How Helicopter Safety Varies By Region
- How Helicopterstour Uses This Data To Vet Every Tour
- Where This Data Comes From
- How Helicopterstour Vets Safety Data For You
- The Gap Between What The Statistics Promise And What They Actually Tell You
- Sources
- FAQ
What The Helicopter Crash Statistics Actually Show
Six numbers explain most of what you need to know before digging into the tables and causal breakdowns further down.
- The fatal accident rate hit 0.44 per 100,000 flight hours in 2024, the best mark in a quarter century for U.S. civil helicopters.
- The decade from 2015 through 2024 averaged 118 accidents and 37 fatalities annually in the United States.
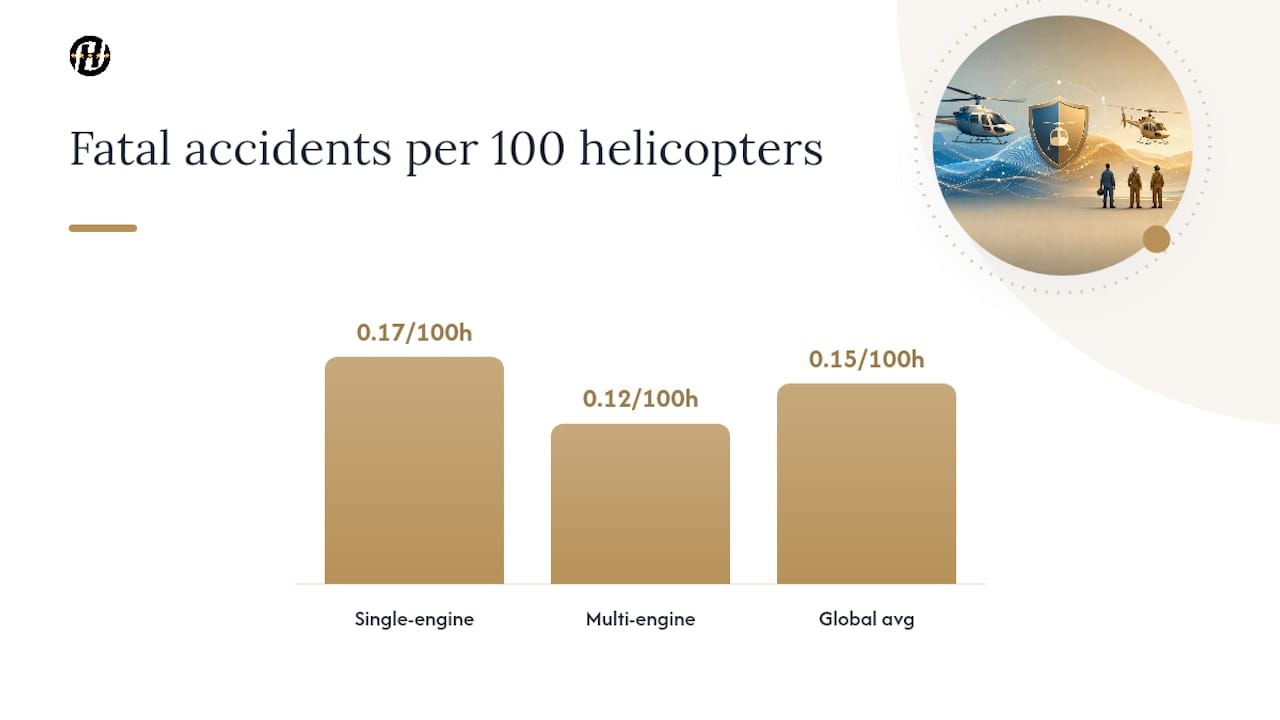
- Globally, Cirium’s five-year moving average for Western-built civil turbine helicopters sits at 0.15 fatal accidents per 100 aircraft, with single-engine models at 0.17 and multi-engine models at 0.12.
- Pilot and operational error remains the single largest causal category, well ahead of mechanical failure.
- External load work, air medical transport, and air tour flights post disproportionately high fatal shares compared to their flight volume, while training flights show high accident counts but comparatively low fatal shares.
- The headline takeaway isn’t that helicopters got dramatically safer overnight. It’s that specific interventions, and specific mission types, are pulling the average in opposite directions at the same time.
Annual Accident Counts And Normalized Crash Rates
Raw accident counts only tell part of the story, because a growing or shrinking fleet changes what a “typical” year looks like. That’s why safety analysts lean on normalized rates, accidents divided by flight hours or fleet size, rather than the headline count alone.
The NTSB’s public accident query tool, which has tracked U.S. civil aviation events since 1962, remains the backbone for year-by-year tallies. Cross-referenced against FAA/ASIAS flight-hour data, the last decade of U.S. civil helicopter activity looks like this:
| Period | Avg. Annual Accidents | Avg. Annual Fatalities | Notes |
|---|---|---|---|
| 2015–2024 (10-yr avg.) | 118 | 37 | NTSB-derived decade analysis |
| 2024 (single year) | Rate: 2.99 per 100,000 hrs | Rate: 0.44 per 100,000 hrs | Lowest fatal rate in 25 years |
| Global fleet (5-yr moving avg.) | Not tallied by count | 0.15 per 100 helicopters | Cirium 2025 review |
2024 U.S. fatal accident rate: 0.44 per 100,000 flight hours, down from a historical average closer to double that figure a decade earlier, according to Vertical Aviation International’s safety reporting. That single-year drop matters more than it might look on paper, because fatal rates in this industry typically move in small increments year over year.
The global comparator adds useful context. Cirium’s fleet has more than doubled in size since 1990, which means a stable or declining fatal rate against a much larger denominator represents a real improvement, not a statistical illusion caused by fewer aircraft flying. The single-engine versus multi-engine split, 0.17 versus 0.12 fatal accidents per 100 helicopters, also confirms something operators have suspected for years: redundancy in the powerplant buys a measurable safety margin, particularly for passenger-carrying missions where an engine failure over unsuitable terrain leaves fewer options.
Monthly rotorcraft dashboards from Vertical Aviation break this down further by sector, showing that air ambulance, personal/private, and aerial application flights each carry distinct risk profiles that a single annual number tends to flatten out.
What Causes Most Helicopter Crashes
Pilot and operational error dominates the causal breakdown, and it isn’t close. Weather-related decision errors, misjudged terrain clearance, and loss of control during low-altitude maneuvering account for the largest single share of accidents across most multi-year NTSB reviews. Mechanical and electrical failures come next, though they represent a smaller and generally shrinking slice as maintenance practices and component reliability improve.
- Pilot and operational error: the leading category, spanning weather decision-making, spatial disorientation, and control errors during takeoff or landing.
- Mechanical and electrical failure: engine, rotor system, or electrical faults that force an unplanned landing or loss of control.
- Weather: often intertwined with pilot error, since most weather-related accidents stem from a decision to continue flight into deteriorating conditions rather than the weather itself.
- Human factors beyond piloting: fatigue, inadequate pre-flight planning, and organizational pressure to complete a mission on schedule.
Mission type changes the picture substantially. External load operations, such as construction lifts and firefighting support, carry an elevated fatal share relative to their flight volume because the work happens at low altitude near obstacles with reduced margin for error. Air medical transport shows similarly disproportionate risk: published studies of helicopter emergency medical services report crash rates between roughly 0.4 and 3.05 per 10,000 missions, with fatal rates ranging from 0.04 to 2.12 per 10,000 missions depending on the country and rescue system studied. Air tour and sightseeing flights also show a higher fatal share than their volume alone would predict. Training flights sit at the opposite end. They generate a high number of accidents, largely minor, because student pilots are actively practicing maneuvers that carry the highest error rates, but the fatal share stays comparatively low.
Operating part matters too. Part 91 general operations account for the majority of U.S. helicopter accidents by raw count, but commercial Part 135 charter operations, which face stricter oversight requirements, tend to show better fatal-rate performance per flight hour. FAA safety briefings note that passengers often assume a professional-looking flight is uniformly regulated, when in practice a Part 91 operation can carry meaningfully less regulatory scrutiny than a Part 135 charter covering a similar route.
The Long-Term Safety Trend, And What’s Driving It
The multi-year direction is clear even if any single year bounces around: fatal accident rates have trended downward across the last two and a half decades, and 2024’s 0.44 per 100,000 flight hours mark represents a genuine milestone rather than a one-off statistical dip.
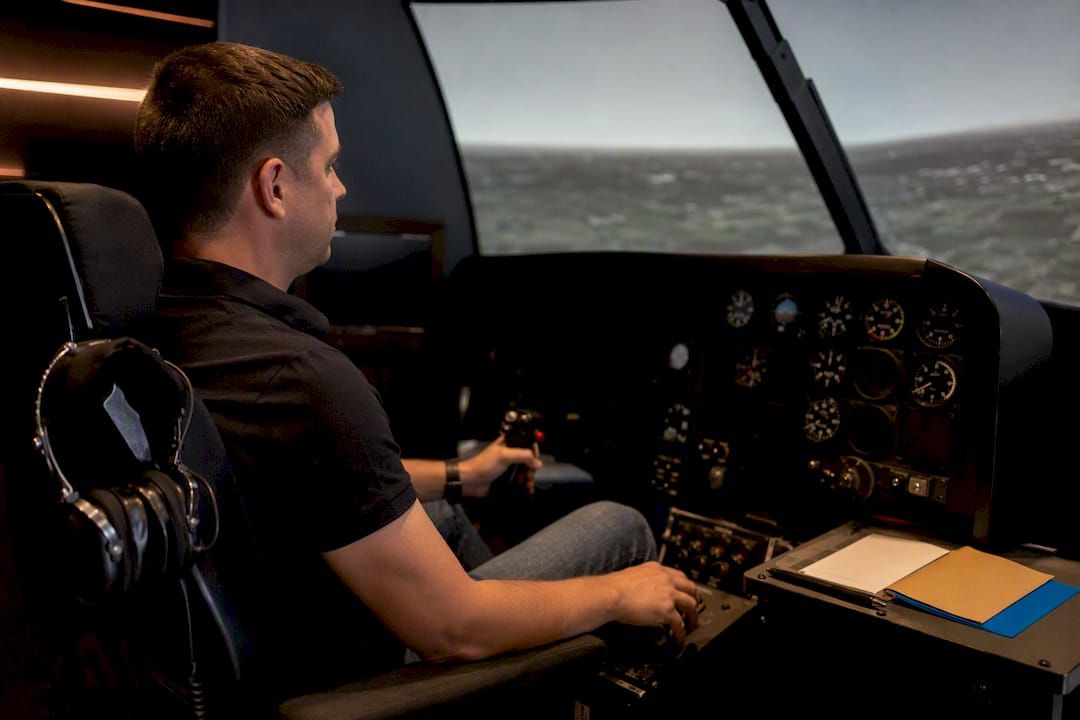
Industry analysts credit a combination of interventions rather than any single fix. Flight data monitoring (FDM) programs let operators review real flight parameters after every leg, catching risky patterns before they become accidents. Simulation-based training, including virtual and augmented reality platforms, gives pilots repeated exposure to emergency scenarios they’d otherwise encounter only once, if at all. Stability augmentation systems and autopilots reduce workload during the highest-risk phases of flight, low-altitude maneuvering and degraded visual conditions. Safety Management Systems (SMS) formalize the reporting and correction of small errors before they compound.
The Flight Safety Foundation has emphasized that no single technology solves this problem on its own. The gains come from stacking multiple programs, oversight, training, engineering, and survivability design, on top of each other.
Pro Tip: If you’re comparing two operators and one advertises FDM or SMS participation on its website, that’s a genuine signal worth weighing. Most operators that invest in either program mention it, because it costs money and they want credit for it.
The nuance worth remembering: accident counts falling doesn’t automatically mean every mission type gets safer at the same pace. Single-engine platforms and certain high-risk missions remain stubborn hotspots even as the industry-wide average improves.
How To Read Helicopter Crash Data Without Getting Misled
An “accident” in NTSB terminology involves substantial aircraft damage or serious injury/death; an “incident” is a lesser event that doesn’t meet that threshold. Confusing the two inflates or deflates comparisons depending on which term a source actually used. The “per 100,000 flight hours” normalization exists because raw counts mean little without knowing how much flying happened, a fleet that flies twice as many hours will naturally log more events even if it’s just as safe per hour flown.
- Check the source database. The NTSB accident query gives raw U.S. event records; FAA/ASIAS supplies the flight-hour denominators needed to calculate rates; Cirium and Vertical Aviation International publish processed, normalized industry reports.
- Confirm the reporting window. Data typically lags by several months to a year, so a “2026” statistic may actually describe 2024 or 2025 activity.
- Ask about mission mix. A blended rate across air tours, training, and air medical hides very different risk profiles.
What Passengers And Operators Should Take From The Numbers
Statistics only help if they change a decision. For passengers booking a sightseeing flight or charter, a few questions cut through most of the noise:
- Is this a Part 135 commercial operation, or Part 91? The former carries stricter oversight.
- Does the operator participate in flight data monitoring or have a documented Safety Management System?
- Is the aircraft multi-engine, particularly for flights over water, mountains, or dense urban terrain?
- How current is the pilot, and how much time do they have in this specific aircraft type?
For operators, the data points toward a clear priority order: invest in FDM first, since it surfaces problems before they become accidents, then simulation-based recurrent training, then formal SMS adoption, then maintenance program rigor beyond the FAA minimum. Every one of those correlates with lower fatal rates in the reporting reviewed above.
Pro Tip: When comparing sightseeing tours, don’t assume the newest-looking helicopter is the safest choice. Ask about the operator’s training cadence and safety program instead. That’s the detail that actually moves the risk needle, more than the paint job.
Reviewing helicopter tour safety practices before booking, and understanding the difference between private and shared tour formats, gives you a practical framework for applying these questions to an actual reservation.

What Happens To Occupants During A Helicopter Crash
Survivability in a helicopter crash depends heavily on impact angle, descent rate, and whether the cabin structure remains intact enough to protect occupants during the initial impact. Low-speed, controlled-descent accidents, common in autorotation after engine failure, produce far higher survival rates than high-energy impacts involving loss of control or in-flight breakup.
Spinal compression injuries rank among the most common serious outcomes, caused by vertical deceleration forces transmitted through the seat structure during a hard landing. Head and neck injuries follow closely, particularly in accidents without crash-resistant fuel systems or energy-absorbing seats, both of which have become more common on newer airframes but remain absent on many older helicopters still flying commercially. Post-crash fire represents a smaller share of fatalities than in decades past, largely because crash-resistant fuel system requirements phased in for newer designs have reduced fuel-tank rupture on impact.
Water landings introduce a separate survivability category entirely. Rapid submersion and disorientation, rather than the impact itself, account for many fatalities in over-water accidents, which is why operators flying routes over open water increasingly equip aircraft with emergency flotation systems and require passenger briefings on underwater egress. External load and air medical missions, flown at low altitude with limited margin for a controlled descent, tend to produce higher-energy impacts with correspondingly lower survivability compared to cruise-altitude accidents in fixed-wing or higher-altitude rotorcraft operations.
Why Pilot Experience Shows Up So Clearly In The Data
Total flight hours matter, but hours in a specific aircraft type and hours in the specific mission being flown matter more. A pilot with 5,000 hours of ferry flying has a different risk profile than a pilot with 500 hours of dedicated external load or air medical experience, because the skills that prevent accidents in one mission don’t automatically transfer to another.
The FAA’s segment-specific safety data reflects this: commercial Part 135 operations, which impose stricter minimum experience and recurrent training requirements than Part 91, consistently show better fatal-rate outcomes per flight hour. That gap isn’t primarily about aircraft quality. It’s about how much structured, recurring exposure a pilot has had to the specific failure modes their mission is likely to produce.
Simulation training has changed the experience equation in a meaningful way. A pilot can now rehearse an engine-out emergency or a whiteout landing dozens of times in a simulator before ever facing it for real, compressing what used to take years of accumulated hours into a training program measurable in weeks. That’s part of why the industry’s overall fatal rate has improved even as the total pilot population and flight hours have grown.
Newer pilots remain statistically overrepresented in accidents during the first few hundred hours in a new aircraft type, a pattern that holds regardless of total career experience. This is one reason experienced charter operators frequently pair new hires with structured mentorship periods rather than releasing them to solo operations immediately after type training.
How Helicopter Safety Varies By Region
U.S. data dominates public reporting because the NTSB database is comprehensive and free to query, but helicopter risk profiles differ meaningfully by region and regulatory environment. Countries with mature commercial aviation authorities and mandatory SMS requirements for commercial operators tend to track closer to the lower end of Cirium’s global fatal-rate range, while regions with less developed regulatory infrastructure or higher proportions of older, single-engine aircraft in commercial service trend toward the higher end.
Terrain and mission mix drive much of this variation independent of regulation. Mountain rescue and offshore oil-platform support, common in parts of Northern Europe and the North Sea, carry different risk exposure than the air tour and personal-use flights that make up a larger share of U.S. civil helicopter activity. Studies of international air rescue systems show fatal crash rates ranging from 0.04 to 2.12 per 10,000 missions depending on the country studied, a spread wide enough to suggest that national protocols, aircraft standards, and terrain all shape outcomes as much as raw pilot skill.
Tourist-heavy destinations with high seasonal helicopter traffic, coastal sightseeing routes, mountain flightseeing corridors, and island tour operations, warrant particular attention from travelers, since flight volume and terrain complexity both climb during peak season. Fleet age also varies by region: markets with newer average fleets tend to benefit from crash-resistant fuel systems and modern stability augmentation as standard equipment rather than a retrofit, which shows up in comparative fatal-rate performance over time.
How Helicopterstour Uses This Data To Vet Every Tour
Before any operator earns a spot on Helicopterstour, we check for FAA certification and review documented safety practices, not just customer ratings. That verification work directly informs which tours we list and how we rank them against each other.
We treat the same signals covered above, operating part, engine configuration, and demonstrated safety program participation, as part of our evaluation, alongside the thousands of traveler reviews we analyze. If you want to see how that plays out on an actual booking, start with our reviewed helicopter tours or check specific safety guidance for tour passengers before you reserve a seat.
Where This Data Comes From
The NTSB Aviation Query tool holds raw U.S. civil accident records back to 1962, useful if you want to verify a specific event. FAA/ASIAS supplies the flight-hour figures needed to calculate normalized rates. Cirium’s annual safety review and Vertical Aviation International’s reporting translate raw data into industry-wide trend analysis, while peer-reviewed studies like the PMC review of air medical crash rates fill in mission-specific detail the broader databases don’t isolate on their own. Every figure in this article traces back to one of these five sources.
How Helicopterstour Vets Safety Data For You
Reading raw statistics is one thing. Applying them to an actual booking decision is another, and that’s the gap this site exists to close.
Understanding what drives the numbers above, engine configuration, operating part, and documented safety programs, gives you the framework, but you still need it applied to a specific tour and operator. When you’re ready to book, browse our reviewed helicopter tours or compare private versus shared tour formats to match the safety profile you’re comfortable with to the experience you actually want. If timing and visibility factor into your decision, our guide on choosing the best time of day for a helicopter tour covers how weather conditions intersect with both safety and scenery. For a different kind of aerial adventure with similar safety considerations, doors-off helicopter flightseeing over Kauai is worth a look too.
The Gap Between What The Statistics Promise And What They Actually Tell You
Here’s what most coverage of helicopter crash statistics gets backwards: it treats the declining fatal rate as proof that helicopter travel has become uniformly safer, when the real story is that it’s become unevenly safer. A 0.44 per 100,000 flight hours rate is a genuine industry achievement, but it’s an average sitting on top of a distribution where external load work, air medical transport, and single-engine platforms haven’t improved nearly as fast as the commercial passenger sector that most tourists actually fly in.
That distinction should change how you read every safety claim an operator makes. “Our safety record” means almost nothing without knowing which denominator it’s measured against, and against which mission type. A tour operator flying multi-engine aircraft under Part 135 oversight with an active FDM program isn’t just marginally safer than one that isn’t. Based on the fleet-wide gap between single- and multi-engine fatal rates, the difference compounds across every variable that correlates with risk.
The other overlooked point: pilot experience data suggests the first few hundred hours in a new aircraft type carry elevated risk regardless of a pilot’s total career hours. That’s not a knock on newer pilots. It’s a reason to ask any operator, politely, how they structure that transition period, because the answer tells you more about their actual safety culture than any marketing copy will.
— Justin
Sources
- The Safety Dividend – Vertical Aviation International
- FAA ASIAS accident and incident data download
- Helicopter emergency medical services accident rates … – PMC
FAQ
How many helicopters crash a year worldwide?
Global figures vary by fleet and region, but U.S. civil helicopters alone averaged 118 accidents and 37 fatalities annually between 2015 and 2024. Cirium’s global turbine fleet data shows a five-year moving-average fatal rate of 0.15 per 100 helicopters rather than a single worldwide crash count.
Is it safer to fly a plane or a helicopter?
Fixed-wing commercial aviation generally posts lower fatal accident rates per flight hour than helicopters, largely because helicopters more often operate at low altitude, near obstacles, and in missions like external load or air medical work that carry inherently tighter margins. The gap has narrowed as helicopter safety programs like FDM and SMS have matured.
What is the number one cause of a helicopter crash?
Pilot and operational error is the leading causal category across most multi-year NTSB reviews, ahead of mechanical or electrical failure. Weather-related accidents typically trace back to a pilot’s decision to continue flight into deteriorating conditions rather than the weather itself.
How risky is a helicopter ride?
For a passenger on a commercial sightseeing or charter flight, the 2024 U.S. fatal accident rate of 0.44 per 100,000 flight hours suggests a relatively low per-flight risk, though it varies by operator, aircraft type, and whether the flight operates under Part 135 oversight. Checking an operator’s certification and safety program participation before booking is the most practical way to assess individual risk.